

Inflation Reframed (4/5) || Systemic Inflation: The One Measure That Explains Everything
At the country level, inflation begins with money itself.

So far, we’ve looked at inflation from the ground up.
What it really is: money buying less
Why the inflation number feels wrong
Why inflation hits different people differently
All of that lives at the level of experience.
Now we zoom out.
Because beneath all those uneven outcomes, there is a single system-level variable that determines whether inflation can exist at all.
From Rooms to Countries
In the room with chocolates, prices rose for one reason only:
More money was competing for the same goods.
At the level of a nation-state, the question becomes:
How much purchasing power is being added to the system as a whole?
That is not answered by prices.
It is answered by money supply.
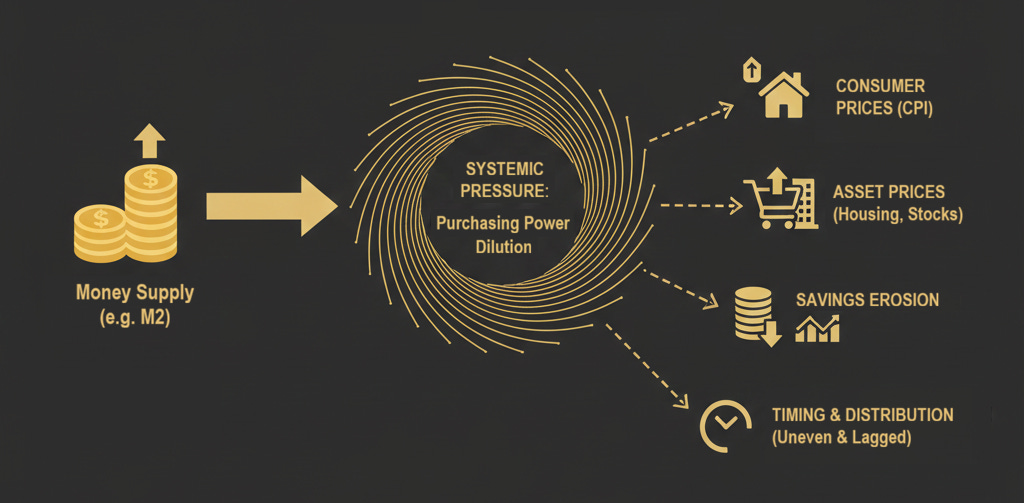
What Money Supply Measures (and Why It Matters)
Money supply - often measured as M2 (or M3 / Broad Money in some countries) - includes:
physical currency
bank deposits
other forms of money that can be readily spent
You don’t need to know the accounting details for this series.
In other words:
M2 measures how much bidding power exists in the economy.
It does not tell you:
which prices will rise
how fast inflation will appear
who will feel it first
It tells you something more fundamental:
Whether systemic pressure exists.
Prices are downstream.
M2 is upstream.
A Clear Definition
Let’s name this cleanly.
Systemic inflation is the long-term dilution of purchasing power caused by persistent expansion of a nation’s money supply.
And just as important:
How that dilution shows up - in food, housing, assets, or services - varies by time, policy, and inequality.
If the unit of account keeps expanding faster than real output, purchasing power cannot remain stable over time.
Everything else is distribution.
Why CPI Can’t Answer This Question
CPI looks at:
baskets of goods
weighted averages
observed prices
Money supply looks at:
the size of the monetary base available for bidding
These are not competing measures.
They operate at different layers.
CPI tells you how inflation shows up.
Money supply tells you why inflation exists systemically.
That’s why CPI can be stable for a while even as systemic pressure builds.
And that’s why inflation can feel sudden when it finally appears.
A Cross-Country Perspective
Across countries and decades, one pattern is remarkably consistent:
Money supply expands persistently.
The differences across countries are not about whether expansion happens, but:
how fast it happens
how long it persists
where the effects show up first
Some countries see inflation first in consumer goods.
Others see it in assets, housing, or financial markets.
But the underlying dynamic is the same.
Why This Is the Easiest National-Level Measure
At the level of an individual:
inflation is personal
uneven
contextual
At the level of a country:
inflation is systemic
mechanical
cumulative
Money supply is the simplest way to see that accumulation.
It does not require:
assumptions about baskets
substitution effects
behavioral modeling
It is an accounting fact.
What This Does Not Explain (Deliberately)
This post is not about:
how money is created
banking systems
central bank operations
policy motives
Those are separate topics.
For the purpose of understanding inflation:
You don’t need to know how money enters the system to observe that it does - and what follows.
This Is the Moment to Look at the Data
Once you accept money supply as capacity rather than outcome, the right way to look at it is not month-to-month volatility, but persistence over long periods.
The charts below do exactly that.
Each bar shows:
height → how fast the money supply grew on average each year (CAGR)
width → how long that growth rate persisted
Taller bars mean faster expansion.
Wider bars mean that expansion lasted longer.
This avoids overstating short bursts or understating long, steady dilution.
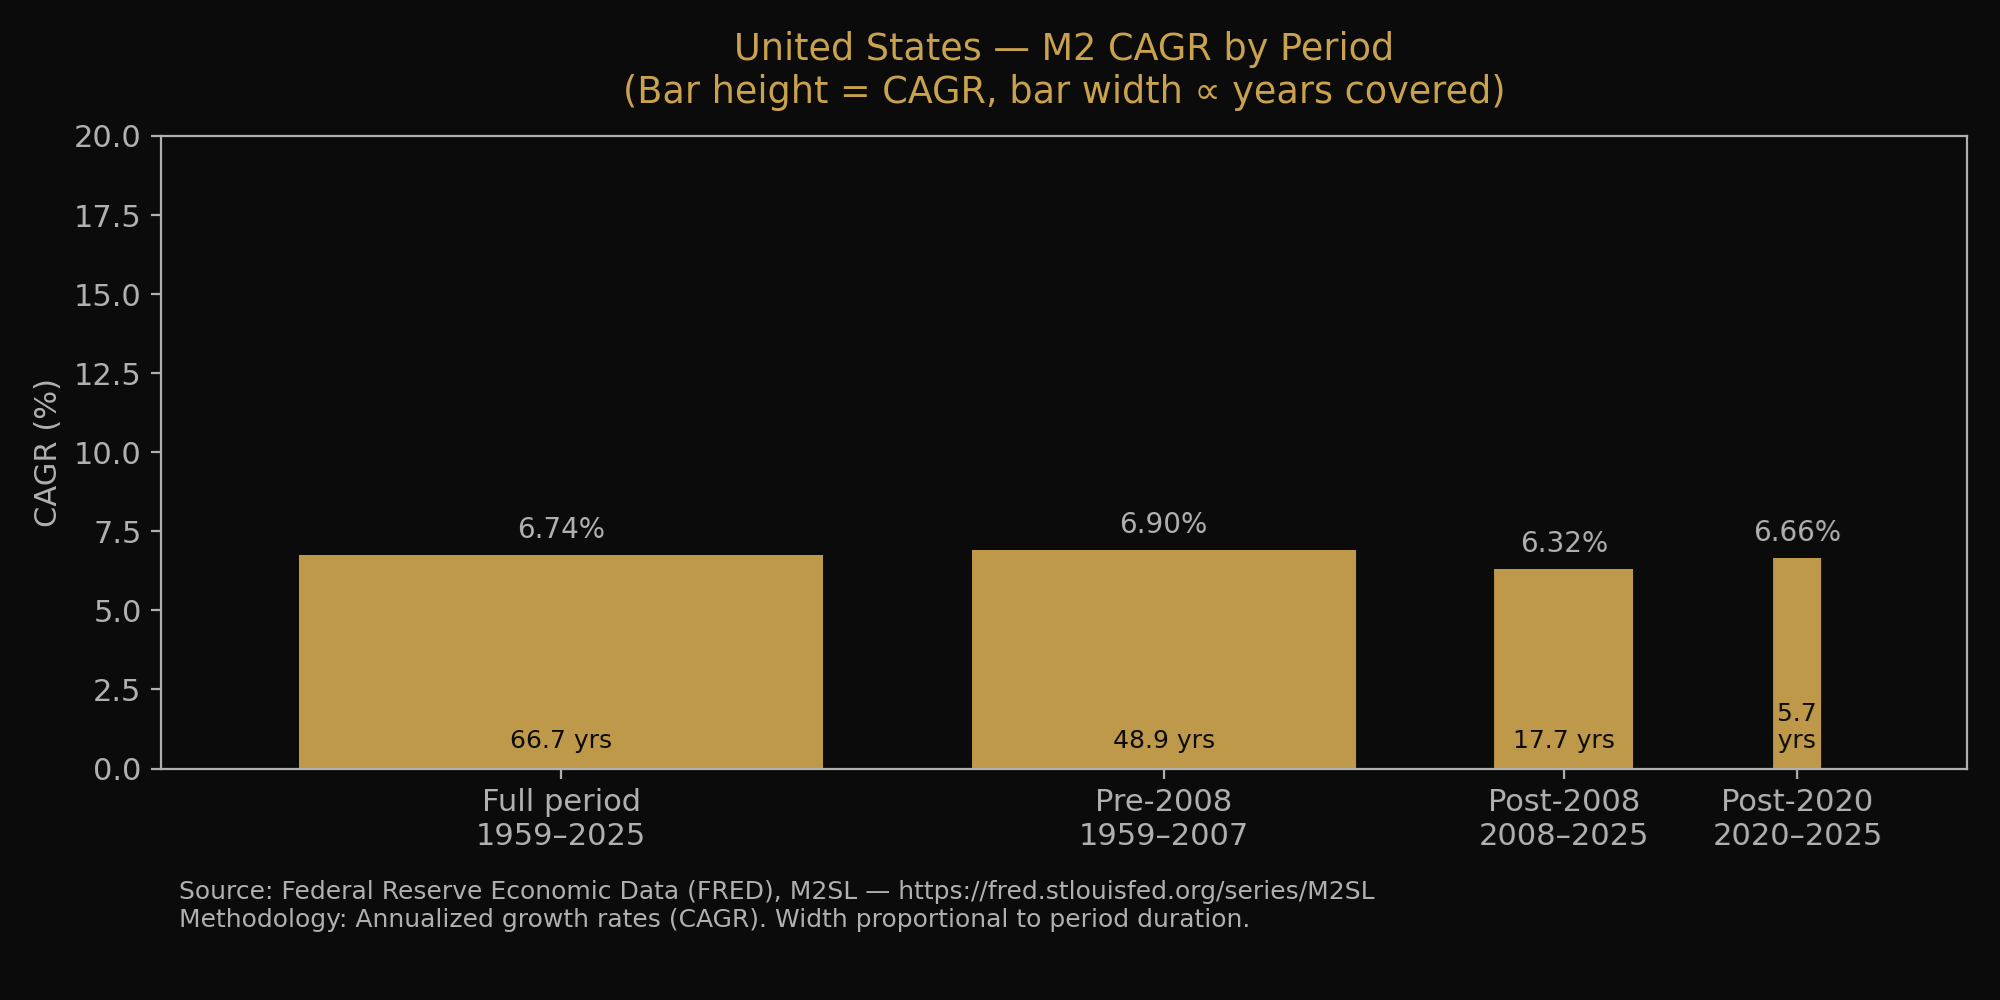
United States - M2 CAGR by Period
(Bar height = annualized growth, bar width ∝ years covered)
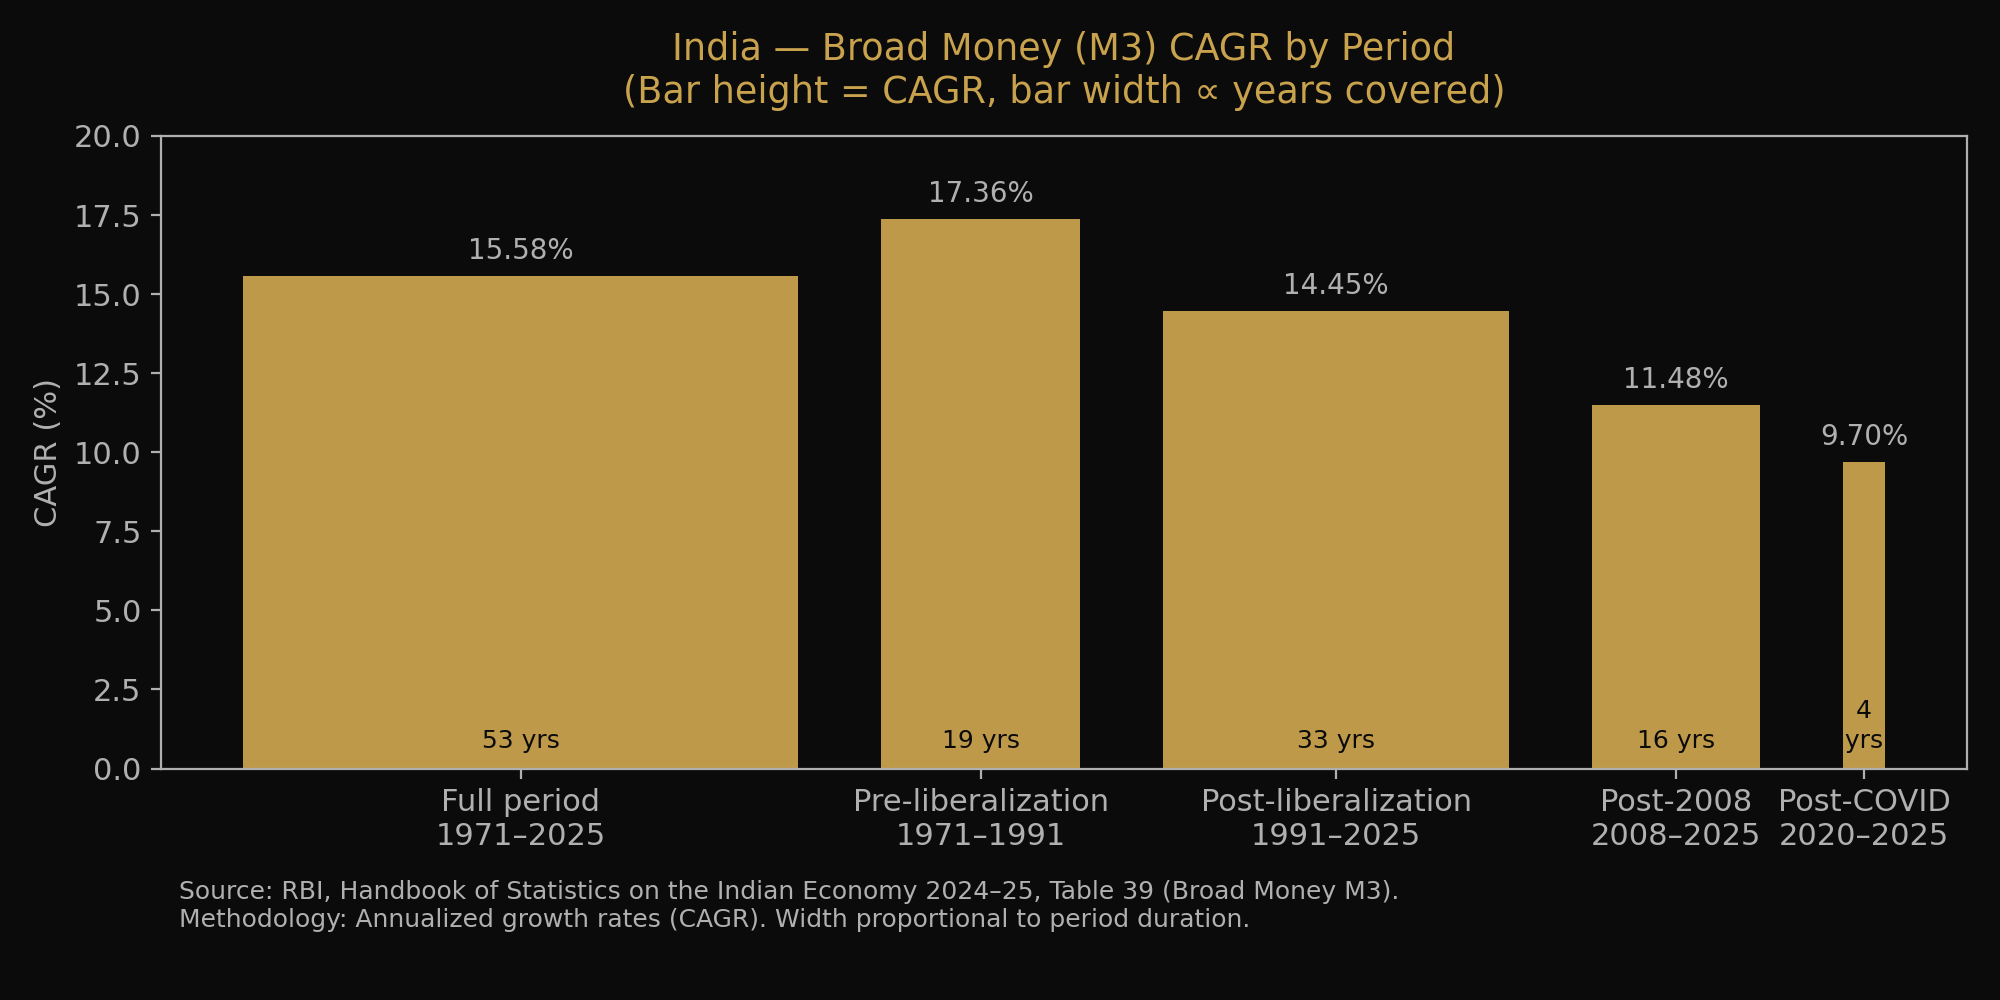
India - Broad Money (M3) CAGR by Period
(Bar height = annualized growth, bar width ∝ years covered)
From Growth Rates to Scale
Growth rates explain speed.
Absolute levels explain magnitude.
In the United States, broad money stood at roughly $287 billion in 1959.
By the end of 2007, it had expanded to about $7.5 trillion - a 26× increase over 49 years.
From there, the pace changed.
By early 2020, broad money had risen again to roughly $15.4 trillion, and by 2025, it exceeded $22 trillion - adding another ~1.5× in just over five years.
Each phase did not reset the system.
It compounded on top of everything that came before.
India shows the same pattern, at a different scale and over a shorter historical window.
In 1971–72, broad money stood at roughly ₹12,700 crore (~$1.27 billion).
By 1990–91, it had grown to about ₹2.66 lakh crore (~$26.6 billion) - a 21× expansion in under two decades.
By 2008–09, broad money crossed ₹47 lakh crore (~$470 billion).
By 2020–21, it had reached nearly ₹1.9 crore crore (~$1.9 trillion), and by 2024–25, approximately ₹2.7 crore crore (~$2.7 trillion) - a further 5–6× expansion within a single working generation.
These are not short-term fluctuations.
They describe the long-term scaling of the monetary base itself.
What These Charts Are - and Are Not - Saying
Over long periods, a pattern becomes hard to ignore.
Money supply expands persistently.
The differences across countries are not about whether expansion happens, but:
how fast it happens
how long it persists
where the effects show up first
These charts do not claim:
that M2 is inflation
that money growth maps mechanically to a CPI number
that prices must rise immediately or uniformly
They show something more basic.
Why We Don’t Say “M2 = X% Inflation”
It’s tempting to turn money supply growth into a single inflation number.
That would be a mistake.
Because between money and prices sit:
changes in velocity
productivity gains
global trade effects
asset vs consumption transmission
distribution and timing
Trying to collapse all that into one percentage weakens the argument.
Instead, M2 should be understood as:
the floor
the pressure
the irreversibility
Prices can pause.
They can rotate.
They can lag.
Purchasing power dilution, once embedded, does not reverse.
A Quiet Cross-Country Insight
One simple observation holds across countries:
Nations differ less in whether they debase than in how fast and where the effects show up first.
That’s why inflation debates look different everywhere - even when the underlying mechanics are similar.
What This Unlocks (Later)
Once you see systemic inflation, several things become easier to understand:
why purchasing power erodes even in “stable” periods
why asset prices trend upward over long horizons
why savings struggle to keep up
why inflation feels episodic but never disappears
why policy debates never quite resolve the issue
You don’t need to accept any grand theory.
You’ve already seen the accounting.
The Takeaway
Inflation is experienced personally.
It is measured imperfectly.
It is distributed unevenly.
But at the level of the nation-state, it begins somewhere simpler.
With the expansion of money itself.
Prices tell you where inflation lands.
Money supply tells you whether it must land somewhere.
What remains is to confront the story we often tell about this process - that inflation is natural, healthy, or even necessary.
That’s next.
Disclaimer
This is educational content, not financial, investment, tax, or legal advice.
Zenca shares perspectives and frameworks to help you think clearly - your decisions are your own.
Please think independently and do your own research.
I write to improve how we think about money.
If this helped you think more clearly about money, you can subscribe to Zenca to receive future essays directly.
Every subscription is a vote for thinking more clearly about money.
And if this resonated, take a few seconds to share it — it might change how someone else thinks about money too.